The Union Budget of 2024-25 presented before India’s Parliament on the first of February is an interim budget. The bulk of the financial year 2024-25, which starts from April 1, 2024, will overlap with the first year of the new legislature and Government that will emerge from the general elections due in a few months. Unlike the last time when a similar situation confronted the BJP government, in 2019, the Government has not felt it necessary this time to depart from the norm – of not using an interim budget to make any significant new announcement. It may be recalled that what became the PM-Kisan scheme was announced during the presentation of the Interim Union Budget for 2019-20 in order to facilitate the transfer of the first batch of payments before the elections.
The interim budget did not involve any new tax proposals, and only extended the validity period of some tax savings schemes due to lapse on 31 March 2024. The allocations for 2024-25 also represent largely a continuity from past trends. The real story, however, lies in those trends – as the revised estimates of 2023-24 have imparted a near finality to the fiscal record of the second Modi government in what has been a period of severe economic disruption. The first year of the Government was the one in which the onset of an economic slowdown became visible to all. Before the budget proposals for the next year, namely 2020-21, could be implemented, and its underlying assumptions tested by experience, these were thrown to the wind by the Covid pandemic and the drastic lockdown implemented by the Government. On the other hand, the same situation made new and exceptional demands on the fisc. Since that massive shock to the economy, bigger than the ones it followed in quick succession – namely demonetisation and the introduction of the GST regime – the Indian economy has been seeking to ‘recover’. Moreover, this recovery has had to confront a more adverse global economic situation arising from both the combined effects of the responses of different countries and their governments to the pandemic as well as the breaking out, into open economic and military warfare, of simmering geopolitical conflicts and tensions.
It is in relation to this context described above that the second Modi government’s fiscal approach has to be assessed. Such an assessment reveals that contrary to the tall claims made, government policy has: a) reinforced severe contractionary trends in India’s macroeconomy; b) aided and abetted a great reset of the economy – a massive shift of income distribution in favour of a narrow stratum of the big business and the rich which does not even have the saving grace of setting the stage for the transition to an expansionary phase of the Indian economy; and c) taken advantage of this situation and its effects to play a faux politics of redistribution. This is effectively the real content of the slogan ‘/Aapda me Avsar/’ (opportunity in crisis) that the PM gave during his ‘Atmanirbhar Bharat’ speech in the midst of the lockdown.
I
To begin with, let us take a summary look at the trends in the Central Government’s revenue and expenditure between 2018-19 and 2023-24 (Table 1).
| Item | 2018-19 | 2019-20 | 2020-21 | 2021-22 | 2022-23 | 2023-24 | 2023-24 |
|---|---|---|---|---|---|---|---|
| Actual | Actual | Actual | Actual | Actual | BE | RE | |
| Indices (2019-20)=100 | |||||||
| GDP at Current Prices | 94.0 | 100 | 98.6 | 116.8 | 135.5 | 147.5 | 147.5 |
| Gross Tax Revenues (Central Taxes) | 103.5 | 100 | 100.8 | 134.8 | 151.9 | 167.2 | 171.0 |
| Assignment to States | 117.0 | 100 | 91.4 | 138.1 | 145.8 | 157.0 | 168.6 |
| Net to Centre | 97.1 | 100 | 105.1 | 133.0 | 154.6 | 171.8 | 171.3 |
| Total Revenue Receipts (Centre) | 92.2 | 100 | 97.0 | 128.8 | 141.5 | 156.3 | 160.3 |
| Total Central Expenditure | 86.2 | 100 | 130.7 | 141.2 | 156.1 | 167.6 | 167.2 |
| Revenue Expenditure | 85.4 | 100 | 131.2 | 136.2 | 146.9 | 149.0 | 150.6 |
| Capital Expenditure | 91.7 | 100 | 127.0 | 176.6 | 220.4 | 298.1 | 283.0 |
| As Percentage of GDP at Current Prices | |||||||
| Gross Tax Revenues (Central Taxes) | 11.0 | 10.0 | 10.2 | 11.5 | 11.2 | 11.3 | 11.6 |
| Assignment to States | 4.0 | 3.2 | 3.0 | 3.8 | 3.5 | 3.4 | 3.7 |
| Net to Centre | 7.0 | 6.7 | 7.2 | 7.7 | 7.7 | 7.9 | 7.8 |
| Total Revenue Receipts (Centre) | 8.2 | 8.4 | 8.2 | 9.2 | 8.7 | 8.9 | 9.1 |
| Total Central Expenditure | 12.2 | 13.4 | 17.7 | 16.2 | 15.4 | 15.2 | 15.1 |
| Revenue Expenditure | 10.6 | 11.7 | 15.5 | 13.6 | 12.7 | 11.8 | 11.9 |
| Capital Expenditure | 1.6 | 1.7 | 2.1 | 2.5 | 2.7 | 3.4 | 3.2 |
Source: Union Budget, various years, and National Accounts Statistics (NAS)
From these trends, the following points emerge:
- Though the revenue situation, specially revenues from taxes, appeared to be under pressure before the pandemic and in its first year too, there has been a sharp recovery of these revenues from 2021-22 itself. This growth in revenues has outstripped the increase in nominal GDP by a wide margin.
- While expenditure levels had to be sustained or stepped up initially in the first year of the pandemic, the growth in these expenditures also moderated from 2021-22. By 2023-24 the situation is that the increase in expenditures relative to 2019-20 has been brought into line with the increase in revenues. In other words, growth in expenditures between the pre-pandemic year of 2019-20 and 2023-24 eventually has not outstripped revenues. In 2023-24 actually, though revenue receipts were more than the budget estimates, the revised estimates for expenditures are lower.
- Moreover, it also appears that the Government has also managed a significant shift in the composition of its expenditures in favour of capital expenditures at the expense of the allegedly less productive revenue expenditures (though in 2023-24, the revised estimates put capital expenditures at a level below what had been budgeted).
- The fiscal pressures on the Central Government in fact were kept in check by effectively delaying the sharing of central taxes with states. When the fiscal situation was initially under pressure, the Centre maintained a ‘healthier’ revenue situation by squeezing the state’s share. It is only when this eased and central expenditures started moderating that the sharing with states was allowed to recover somewhat.
- In letter as well as spirit, the fundamental principles of fiscal conservatism were thus quite strictly adhered to by the Modi government notwithstanding the once in a lifetime crisis faced by the country and the economy. This first served to severely limit the retreat forced by the pandemic, and then the initiation of a prompt reversal that did not even wait for economic recovery. After the 2008 crisis, whose impact on India’s economy was of a much lesser order than that of the lockdown, the return to the path of ‘fiscal consolidation’ after the initial stimulus response at least took a few years, starting only in 2011-12. This time, it started in the very next year. If after the decline in expenditure to GDP ratio by 2.6 percentage points between 2020-21 and 2023-24 that accompanied an increase in the centre’s revenue receipts by 0.7 percentage points, there is still a road to be travelled to achieve the much vaunted target of the fiscal-deficit ratio, part of the reason is what has happened to the denominator in that ratio.
II
The nominal growth of GDP of course consists of two parts – one contributed by ‘real’ growth and the other by the increase in prices. If we compare the changes in these two components between 2019-20 and 2022-23 with those in the previous two similar three year periods levels (Figure 1), we can see a clear trajectory indicating that the effect of the pandemic was to reinforce an existing trend of a post-demonetisation slowing down of real growth and acceleration of inflation. In other words, the relatively high growth rate of 2022-23 was simply reflecting a recovery from the sharp collapse rather than a shift to a trend of high growth.
Figure 1: India: Real and Inflation Components in increase of Nominal GDP, Selected Periods (%)
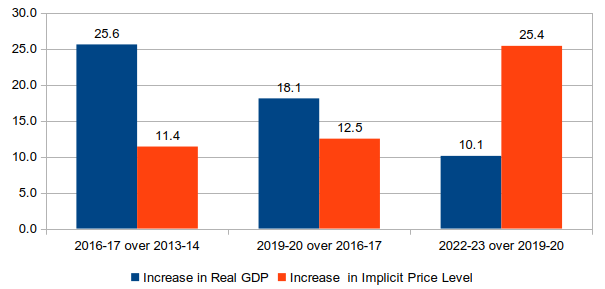
Source: Based on the National Accounts Statistics data
The year 2023-24, however, seems to be very different if one considers the First Advance Estimates of GDP for 2023-24 and the GDP figures for the first two quarters, or first half, of the year (Table 2). That inflation has almost disappeared is the claim made to extract a 7.3 percent estimated growth in ‘real’ GDP in 2023-24 from a mere 8.9 percent increase in nominal GDP, and a 7.7 growth in H1 from a nominal GDP growth of just 8.6 percent.
| Item | Q 1 | Q 2 | H 1 | Full Year (FAE) |
|---|---|---|---|---|
| Increase in Nominal GDP (%) | 8.0 | 9.1 | 8.6 | 8.9 |
| Increase in Real GDP (%) | 7.8 | 7.6 | 7.7 | 7.3 |
| Implicit Inflation Rate (%) | 0.2 | 1.5 | 0.9 | 1.5 |
| Item | Q 1 | Q 2 | Average up to November | |
| CPI Inflation Rate (%) | 4.6 | 6.4 | 5.5 | |
| WPI Inflation Rate (%) | -2.9 | -0.7 | -1.3 |
Source: National Accounts Statistics
The implicit inflation rates underlying these results, however, appear absurd when set against the inflation rates based on the Consumer Price Index (CPI), in which the food component has experienced even higher and near double digit inflation rates. They are also inconsistent with the fact that the RBI’s inflation targeting has led to it holding its repo rate at 6.5 percent since February 2023, after raising it from levels prevailing in the previous year. If the inflation rate was really as low as is implied in GDP data, the real rate of interest must be excessively high. That this growth is therefore a statistical illusion resulting from the methods used to adjust for increases in prices is further indicated by the fact that Private Final Consumption Expenditure (PFCE), which at 57-58 percent is by far the largest item of expenditure in GDP, contributed to only 35 percent of the ‘real’ growth in 2023-24, rising by just 3.5 percent in per capita terms and 4.4 percent in the aggregate. On the other hand, ‘discrepancies’ account for as much as 55 percent of the growth in real GDP.
It is possible that some parts of the economy are facing a situation of low prices, and some are benefiting from reduction in input prices that in part reflect international price trends. However, these price trends may themselves reflect a depressed demand situation rather than an expansionary momentum. If one looks at the production measure (GVA), the ‘real’ growth of 6.9 percent is derived assuming a negative inflation rate not only in the case of manufacturing, but also sectors like Construction and services like Trade, Hotels, Transport and Communication. Near zero inflation is also assumed in the case of Financial, Real Estate and Professional Services, which is supposed to have grown by 8.9 percent in 2023-24 and contributed 29 percent of the total GVA growth. The use of proxy price indices like the WPI, which has shown a different trend from the CPI because of differences in the composition of goods included, has clearly affected these figures.
If account is taken of all these factors, it is clear that the GDP growth figures are creating an entirely distorted picture of what is happening to the incomes and purchasing power of the large majority of the people. Notwithstanding the claims of India being the brightest spot in the world economy, economic activity levels have remained depressed in the post-Covid era and the contractionary tendencies visible even before it have only become stronger. India’s new GDP series with 2011-12 as base year data has of course been also suspected of inflating real growth since the with 2011-12 as the base year was introduced. We also know that all the shocks of the last 8 years have had a significantly more adverse effect on the unorganised sector, but the methods of estimation of unorganised sector contribution to GDP have not been updated, let alone in a way that can capture this disproportionately larger destructive effect it has suffered. So the aggregate picture may be even grimmer than that which can be inferred from the GDP data.
III
If the economy is in such a depressed state, how is it that tax revenues have gone up? The answer is clear if one looks at where the increases have mainly come from (Table 3). The fastest increase has taken place in direct taxes – corporate and personal income taxes. These seem to have been hit severely by the economic downturn, in both 2019-20 as well as 2020-21 – though partly this was on account of corporate tax concessions announced in 2019-20 in response to the slowdown. In fact, the Government initially relied heavily on raising excise duties on oil products to shore up the flagging revenues. It thus imposed additional taxes on ordinary people at the time of their greatest economic distress, through the effect of these taxes on oil prices and through them on all other prices. These excise duties were then subsequently brought down as international oil prices soared – but this did not bring down the retail prices of oil and diesel as they remained at the same elevated levels.
| 2018-19 |
2019-20 |
2020-21 |
2021-22 |
2022-23 |
2023-24 |
|
|---|---|---|---|---|---|---|
| Actual | Actual | Actual | Actual | Actual | RE | |
| Indices (2019-20)=100 | ||||||
| Gross Tax Revenue | 103.5 | 100 | 100.8 | 134.8 | 151.9 | 171.0 |
| Corporate Tax | 119.2 | 100 | 82.2 | 127.9 | 148.3 | 165.7 |
| Income Tax | 96.0 | 100 | 98.9 | 141.3 | 169.1 | 207.5 |
| GST Total | 97.1 | 100 | 91.7 | 116.6 | 141.8 | 159.8 |
| Customs | 107.8 | 100 | 123.3 | 182.8 | 195.2 | 200.1 |
| Excise | 96.4 | 100 | 162.8 | 164.0 | 132.6 | 126.2 |
| As Percentage of GDP at Current Prices | ||||||
| Gross Tax Revenue | 10.0 | 10.0 | 10.2 | 11.4 | 10.7 | 11.1 |
| Corporate Tax | 2.8 | 2.8 | 2.3 | 3.0 | 2.8 | 3.1 |
| Income Tax | 2.5 | 2.5 | 2.5 | 2.9 | 2.7 | 3.0 |
| GST Total | 3.0 | 3.0 | 2.8 | 3.0 | 3.0 | 3.2 |
| Customs | 0.5 | 0.5 | 0.7 | 0.8 | 0.8 | 0.8 |
| Excise | 1.2 | 1.2 | 2.0 | 1.7 | 1.3 | 1.1 |
Source: Union Budget and National Accounts Statistics
The source of the sharp recovery in direct taxes, beyond what would be dictated by simply the revival at the aggregate level, is clearly due to the faster growth of the income base for these taxes since rates have not gone up. This increase is a reflection of not some significant widening of the numbers paying these taxes or their greater level of compliance – but instead reflects the increase in the share in total income of a small minority of companies and individuals.
Whether one looks at individuals, HUFs, Firms, AOPs/BOIs – income tax data clearly indicate that in each case, even among the number of those filing returns, a relatively small number account for the bulk of the taxable income and tax liability, while the majority do not have taxable incomes large enough to have any tax liability. The latest data for instance show that while more than 6.64 crore individuals, HUFs, Firms and AOPs/BOIs filed income tax returns in AY 2021-22, less than 2.25 crores had a positive tax liability payable. Of these too, less than a quarter (under 0.52 crores or 5.2 million) accounted for nearly 87 percent of the income taxes payable, and therefore the bulk of the taxable income. This is in a population of over 136 crores with over 30 crore households. In case of companies too, a very small number among the 9.65 lakh plus who filed returns in AY 2021-22 accounted for a big chunk of total income as well as taxes. While 5.81 lakh companies reported losses or zero profits, just 520 companies accounted for over 56.4 percent of the gross income of all companies and another 1757 accounted for an additional 18.7 percent. Correspondingly, the top 583 companies were responsible for 58 percent of the corporate tax payable.
If we look at the other end of the spectrum, to those who earn their livelihood through their labouring activity, the picture appears to be quite the opposite. The PLFS data at first appearance seem to suggest a paradoxical phenomenon of employment growth in India picking up significantly precisely when production activity became more depressed (Table 4). A reversal of the trend of decline in the employment to population ratio, and of declining work participation of women, that had held for a decade and a half till 2017-18, seems to have been the result.
| Category | 2017-18 | 2019-20 | 2021-22 | 2022-23 |
|---|---|---|---|---|
| Employment to Population (%) | ||||
| Male | 52.1 | 53.9 | 54.8 | 54.4 |
| Female | 16.5 | 21.8 | 24.0 | 27.0 |
| Persons | 34.7 | 38.2 | 39.6 | 41.1 |
| Usual Status Employment (Million) | ||||
| Rural | 325 | 366 | 402 | 423 |
| Urban | 131 | 146 | 141 | 145 |
| Total | 456 | 512 | 542 | 568 |
| Usual Status Employment by Type/Sector (Million) | ||||
| Self-Employed | 238 | 274 | 303 | 326 |
| of which: Helper in HH Enterprise | 62 | 81 | 95 | 104 |
| Regular | 104 | 117 | 117 | 119 |
| Casual | 114 | 121 | 123 | 124 |
| Agriculture | 201 | 234 | 247 | 260 |
Source: Based on PLFS Annual Reports and NAS
However, it is clear that this ‘employment growth’ is clearly not reflecting in income growth. The entire increase, particularly after Covid, has been in self-employment with regular employment stagnating. It is entirely concentrated in rural areas with no growth of urban employment, and a significant chunk of the increase reflects a return of workers to agriculture. Moreover, if one sees the earnings from this employment, money wage rates have clearly not kept pace with the rise in prices (Table 5). As far as self employment is concerned, the levels of the nominal monthly earnings per employed person have been lower since than in 2017-18, collapsed in the first year of the pandemics, and even after recovering their level has not been restored. Indeed, in real terms the combined earnings of the self-employed have shrunk – the increase in their numbers being more than neutralised by the reduction in per worker earnings.
| Item | Percentage change |
|---|---|
| Average wage/salary earnings (in Rs) during the preceding calendar month by the regular wage/salaried employees in current weekly status | 14.7 |
| Average earnings (in Rs.) per day by casual labour engaged in works other than public works | 27.5 |
| Average gross earnings (in Rs.) during the last 30 days from self-employment work in current weekly status | -10.3 |
| Nominal Per Capita GDP | 51.5 |
| Real Per Capita GDP | 15.4 |
Source: PLFS Annual Reports and National Accounts Statistics
Thus it is clear that the Covid crisis has provided the background for a significant tilting of the distribution of income sharply in favour of big business and the rich and wealthy. This is clearly what underlies the significant jump in revenues from corporate taxes and income taxes. Indeed, even the GST revenues are likely to have been pushed up by this process due to increased share of higher rate items in the spending of the better off. A similar rise in direct taxes happened in the period of a few years preceding the 2008 global crisis. The difference was that in that period, rising inequality was in the background of a booming economy. This time around, it has happened in a time of crisis. What is referred to as the K-Shaped recovery is therefore not even really a recovery. It is instead a great reset in the distribution of a slow growing income achieved by taking advantage of the crisis. It is the working people who have been made to adjust to lower incomes – they have suffered the double hit of a contractionary trend in their money earnings being combined with significant rises in prices of food and other essential consumption goods. Big business groups and the rich have as a result prospered in the midst of crisis. The narrowness of the gains is such that even many smaller enterprises in both the organised as well as unorganised sectors are likely to have suffered the consequences of the depressed economic situation.
The Modi Government has thus temporarily enjoyed the benefit of being instrumental in this great reset of the Indian economy. Instead of countering it through greater efforts at resource mobilisation from the gainers and appropriate fiscal spending, the Government has aggravated them. Its lockdown measures and handling of the pandemic, limited relief to those it pushed into distress, the initial use of oil taxes, and the general priority it has accorded to the objective of reduction of the fiscal deficit by containing expenditures have all played their part in making this redistribution possible. Unfortunately, neither the reset nor this fiscal approach can generate an expansionary momentum in the Indian economy – exhaustion of the possibilities of growth through increased inequality being already reflected in the sustained decline of the investment ratio over a period of a decade and a half.
IV
It is of course being argued that even if expenditure is not going up rapidly, capital expenditures by the government are, and this public investment will have a crowding-in effect on private investment. In her budget speech this year, the FM emphasised “the massive tripling of the capital expenditure outlay in the past 4 years resulting in huge multiplier impact on economic growth and employment creation”. Unfortunately, the supposed rise in capital outlays is more an illusion than a reality – a product of purely accounting norms. Public investment includes both the capital expenditure on Government account as well as that undertaken by public enterprises. From the point of view of the macroeconomic effects of the magnitude of public investment, it is the combined figure which matters and it is immaterial how that aggregate is distributed between the two heads. The Expenditure Budget actually contains also the figures of capital expenditures financed by the resources of public enterprises. As can be seen in Table 6, this figure has been falling steadily even as the expenditure through the budget has increased. The combined total thus shows no spectacular rise, and as a percentage of GDP has tended to be lower after 2019-20 than before.
| Head | 2018-19 | 2019-20 | 2020-21 | 2021-22 | 2022-23 | 2023-24 |
|---|---|---|---|---|---|---|
| Actual | Actual | Actual | Actual | Actual | RE | |
| Indices (2019-20)=100 | ||||||
| Total Capital Expenditure through Budget | 91.7 | 100 | 127.0 | 176.6 | 220.4 | 283.0 |
| Resources of Public Enterprises | 94.8 | 100 | 74.5 | 68.2 | 56.6 | 50.8 |
| Total Expenditure through Budget and Resources of Public Enterprises | 93.7 | 100 | 92.5 | 105.4 | 112.9 | 130.6 |
| As Percentage of GDP at Current Prices | ||||||
| Total Capital Expenditure through Budget | 1.6 | 1.7 | 2.1 | 2.5 | 2.7 | 3.2 |
| Resources of Public Enterprises | 3.2 | 3.2 | 2.4 | 1.9 | 1.3 | 1.1 |
| Total Expenditure through Budget and Resources of Public Enterprises | 4.8 | 4.9 | 4.6 | 4.4 | 4.0 | 4.3 |
Source: Union Budget and National Accounts Statistics
There are in addition, other accounting niceties which have also inflated the increases in capital expenditure through the budget. For instance, loans to states for capital expenditures were stepped up from 2022-23, but they effectively replaced the back to back loans in lieu of the GST compensation shortfall given in the previous year. While these new loans in both 2022-23 and 2023-24 were less than the loans given in 2020-21, they were included in capital expenditures while the loan in lieu of GST compensation shortfall had been netted out against the corresponding central government borrowing and therefore did not appear as an expenditure.
The stepping up of capital expenditure through the budget has of course involved squeezing out of revenue expenditures. It has also affected the spread of public investment, with the bulk of the capital expenditure being concentrated in railways, roads (highways) and telecommunication to the exclusion of everything else. Thus, the so-called stepping up of capital expenditures are also not without adverse distributional effects.
V
Even before the pandemic related reset of the Indian economy, rising inequality and stagnation in labour incomes following liberalisation had produced a steady trend since the mid-1990s, of the pace of revenue growth of the government being faster than of incomes from work. This is shown in Figure 2, with the trend in average wage per ASI factory sector worker serving as a proxy for that of labour incomes in general. This difference in the two growth rates has happened even in phases where the tax to GDP ratio was not rising – because labour incomes grew at a slower rate than per capita incomes.
Figure 2: Per Capita Tax Revenue (Centre+State) Relative to ASI Wage Per Worker, 1981-82 to 2019-20
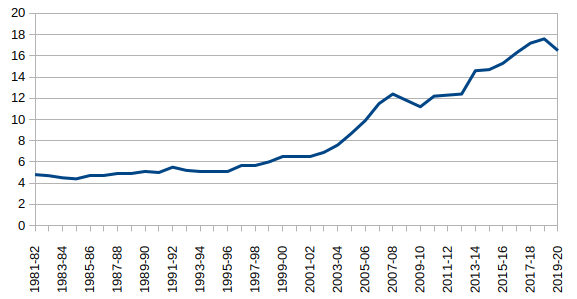
Source: Based on data from RBI, Handbook of Statistics on the Indian Economy, Annual Survey of Industries and the National Accounts Statistics
Thus, despite the state becoming poorer relative to the rich because of lowering of effective levels of taxation, it was simultaneously becoming richer relative to the poor whose incomes were stagnant. This has created the basis for a faux politics of redistribution where even while staying within the boundaries of fiscal conservatism, the different forms of state support to poor and working households could be stepped up in per capita terms. The relative importance of these kinds of support for the households receiving them, despite these still remaining extremely meagre, has also tended to increase precisely because of the stagnation in earnings from economic activity.
An automatic short-term consequence of the post-Covid reset has been a temporary increase in the scope for this faux politics of redistribution. If the rich and the wealthy have been able to make gains with the assistance of the state, the revenue gains from rising inequality coupled with the squeeze on earnings of working people have also made it possible for the state to become even larger in the lives of poor households, even by doing very little. If we see the trends in expenditure, expenditures by the government on ‘schemes’ have not really shown an upward trajectory after the initial rise in the first year of the pandemic, even less so in those involving transfers to states (Table 7). Putting a leash on such expenditures, specially their revenue component, in fact has been very central to the bringing down of the expenditure to GDP ratio. This is reflected in the slower growth of transfers to states for Centrally sponsored schemes, which fall almost entirely under the head of revenue expenditure. The revenue component in the Centre’s Expenditure on Schemes/Projects has also declined. Thus, expenditures on heads like MNREGA and subsidies (food and fertilizer subsidies) in 2023-24 are ending up at levels significantly below those in 2020-21 – down by 22.6 and 41.6 percent respectively (RE to Actual). Yet the expenditures on schemes are at levels much higher than before the pandemic, in sharp contrast to the incomes of working households.
| Head | 2018-19 | 2019-20 | 2020-21 | 2021-22 | 2022-23 | 2023-24 | |
|---|---|---|---|---|---|---|---|
| Actual | Actual | Actual | Actual | Actual | RE | ||
| Indices (2019-20 = 100) | |||||||
| Centre’s | Establishment Expenditure | 91.4 | 100 | 104.2 | 121.6 | 125.3 | 137.1 |
| Expenditure | Central Sector Schemes/Projects | 84.3 | 100 | 179.2 | 159.8 | 191.0 | 191.0 |
| Other Central Sector Expenditure | 93.2 | 100 | 109.8 | 139.0 | 151.9 | 182.8 | |
| of which interest payment | 95.2 | 100 | 111.1 | 131.6 | 151.7 | 172.4 | |
| Transfers | Centrally Sponsored Schemes | 95.6 | 100 | 124.0 | 146.8 | 141.4 | 148.8 |
| Finance Commission Grants | 75.7 | 100 | 148.8 | 167.7 | 139.6 | 113.5 | |
| Other Grants/Loans/Transfers | 44.4 | 100 | 96.8 | 109.7 | 159.9 | 167.2 | |
| Grand Total | 86.2 | 100 | 130.7 | 141.2 | 156.1 | 167.2 | |
| As Percentage of GDP at Current Prices | |||||||
| Centre’s | Establishment Expenditure | 2.8 | 2.8 | 3.0 | 3.0 | 2.6 | 2.6 |
| Expenditure | Central Sector Schemes/Projects | 3.4 | 3.8 | 6.8 | 5.2 | 5.3 | 4.9 |
| Other Central Sector Expenditure | 3.6 | 3.6 | 4.0 | 4.3 | 4.1 | 4.5 | |
| of which interest payment | 3.1 | 3.0 | 3.4 | 3.4 | 3.4 | 3.6 | |
| Transfers | Centrally Sponsored Schemes | 1.6 | 1.5 | 1.9 | 1.9 | 1.6 | 1.6 |
| Finance Commission Grants | 0.5 | 0.6 | 0.9 | 0.9 | 0.6 | 0.5 | |
| Other Grants/Loans/Transfers | 0.5 | 1.0 | 1.0 | 0.9 | 1.2 | 1.1 | |
| Grand Total | 12.2 | 13.4 | 17.7 | 16.2 | 15.4 | 15.1 | |
Source: Union Budget and National Accounts Statistics
Attempts are being made to use the pretence of redistribution to ‘moderate’ the political effects of rising inequality and distress, and to actively place this too in the service of increasing authoritarianism by packaging it as a reflection of the state’s benevolence. The ultimate end both of these serve are to maintain and strengthen the deep structural inequality present in India’s economy. The more such politics succeeds, however, the more it will also thwart the real recovery of the Indian economy. Without such a recovery, on the other hand, the sustainability of even the faux redistribution as an instrument of garnering ‘popular’ support may also prove to be difficult.
(The writer is a Professor of Economics at Jawaharlal Nehru University, New Delhi.)